Neuroglancer
One of the coolest things I’ve seen in my life (the most other impressive thing, in my opinion that I did, was to look at the bacteria phages through electronic microscope back in University) is to work with Neuroglancer. I was very impressed with what technology is able to do nowdays (and realized how much I have to constantly learn and read in order to keep up).
Neuroglancer is high-performance, flexible WebGL-based viewer and visualization framework for volumetric data. It supports a wide variety of data sources and can display arbitrary (non axis-aligned) cross-sectional views of volumetric data and 3-D meshes and line-segment-based models (skeletons). Neuroglancer is a powerful tool for large-scale neuroscience datasets, which can be impractical to visualize with other traditional image viewer applications.
The part I’ve worked with is to install and run Neuroglancer locally. And later, using Jupyter Notebook (in my local environment) create a Navigation Panel where you can manipulate different display settings. This, I did using Python.
This link helped me with the Neuroglancer installation. This link where you can see the Neuroglancer Example in Jupyter Notebook, that I’ve used to create a Nav Panel. This link where you can play with Neuroglancer, with the default Nav Bar. And here is my code.
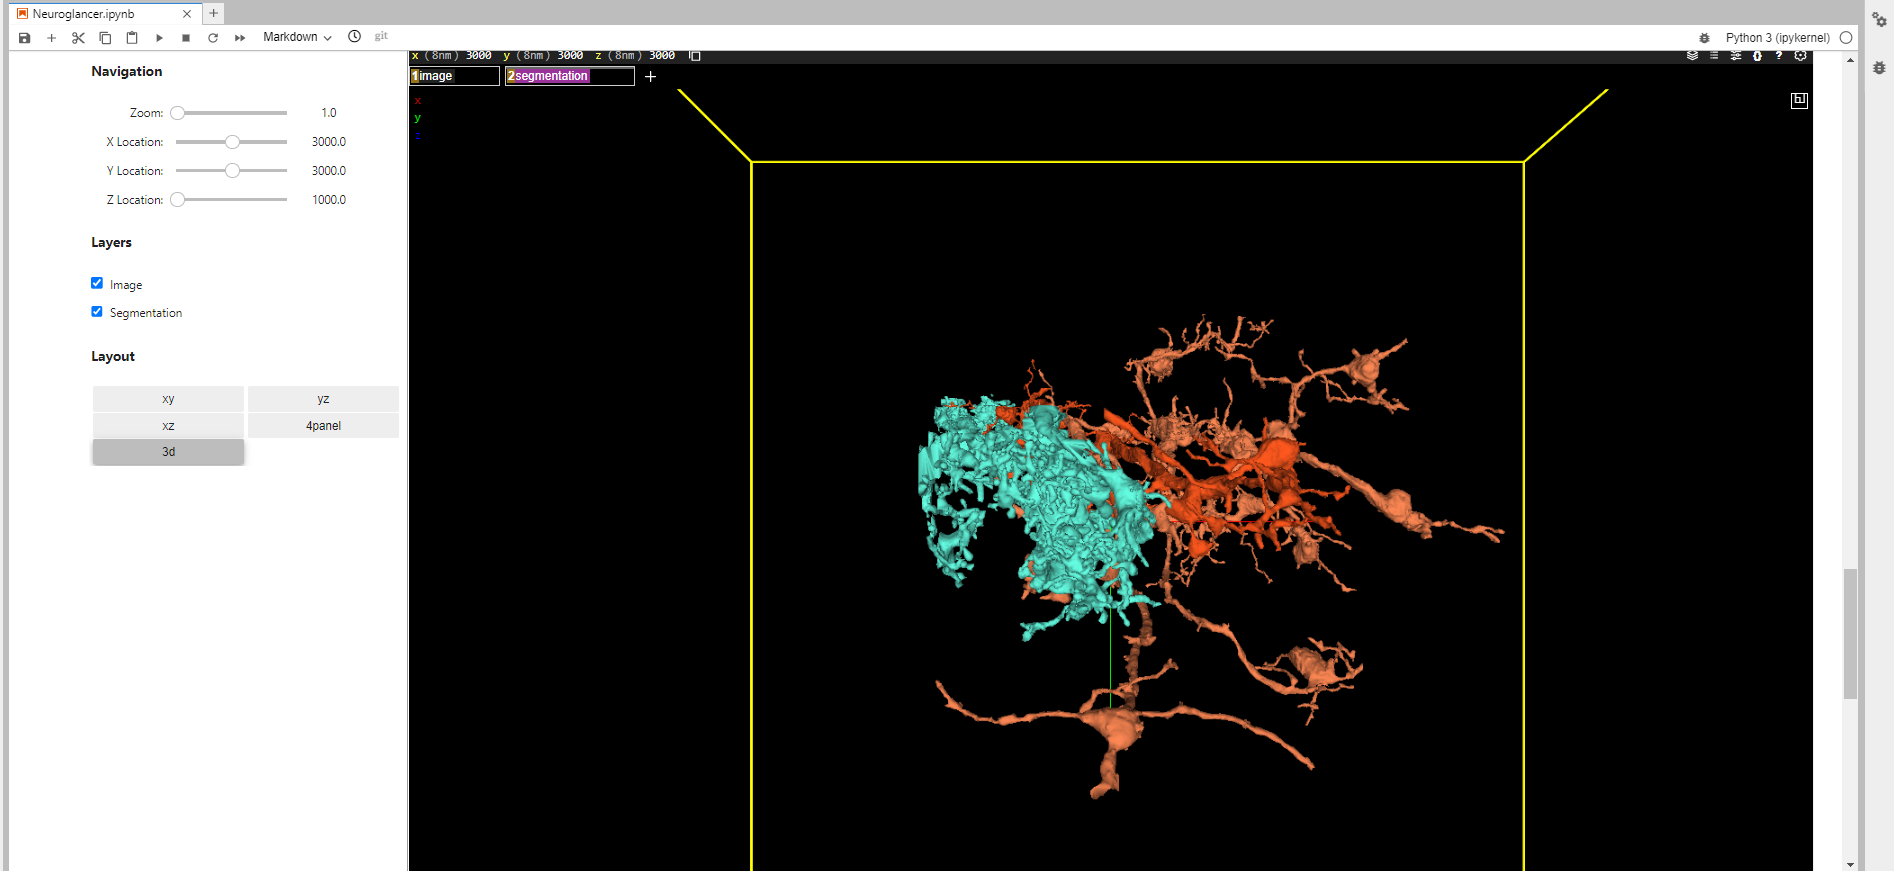
Below is the image of my Navigation Panel (that I’ve made) with the output.
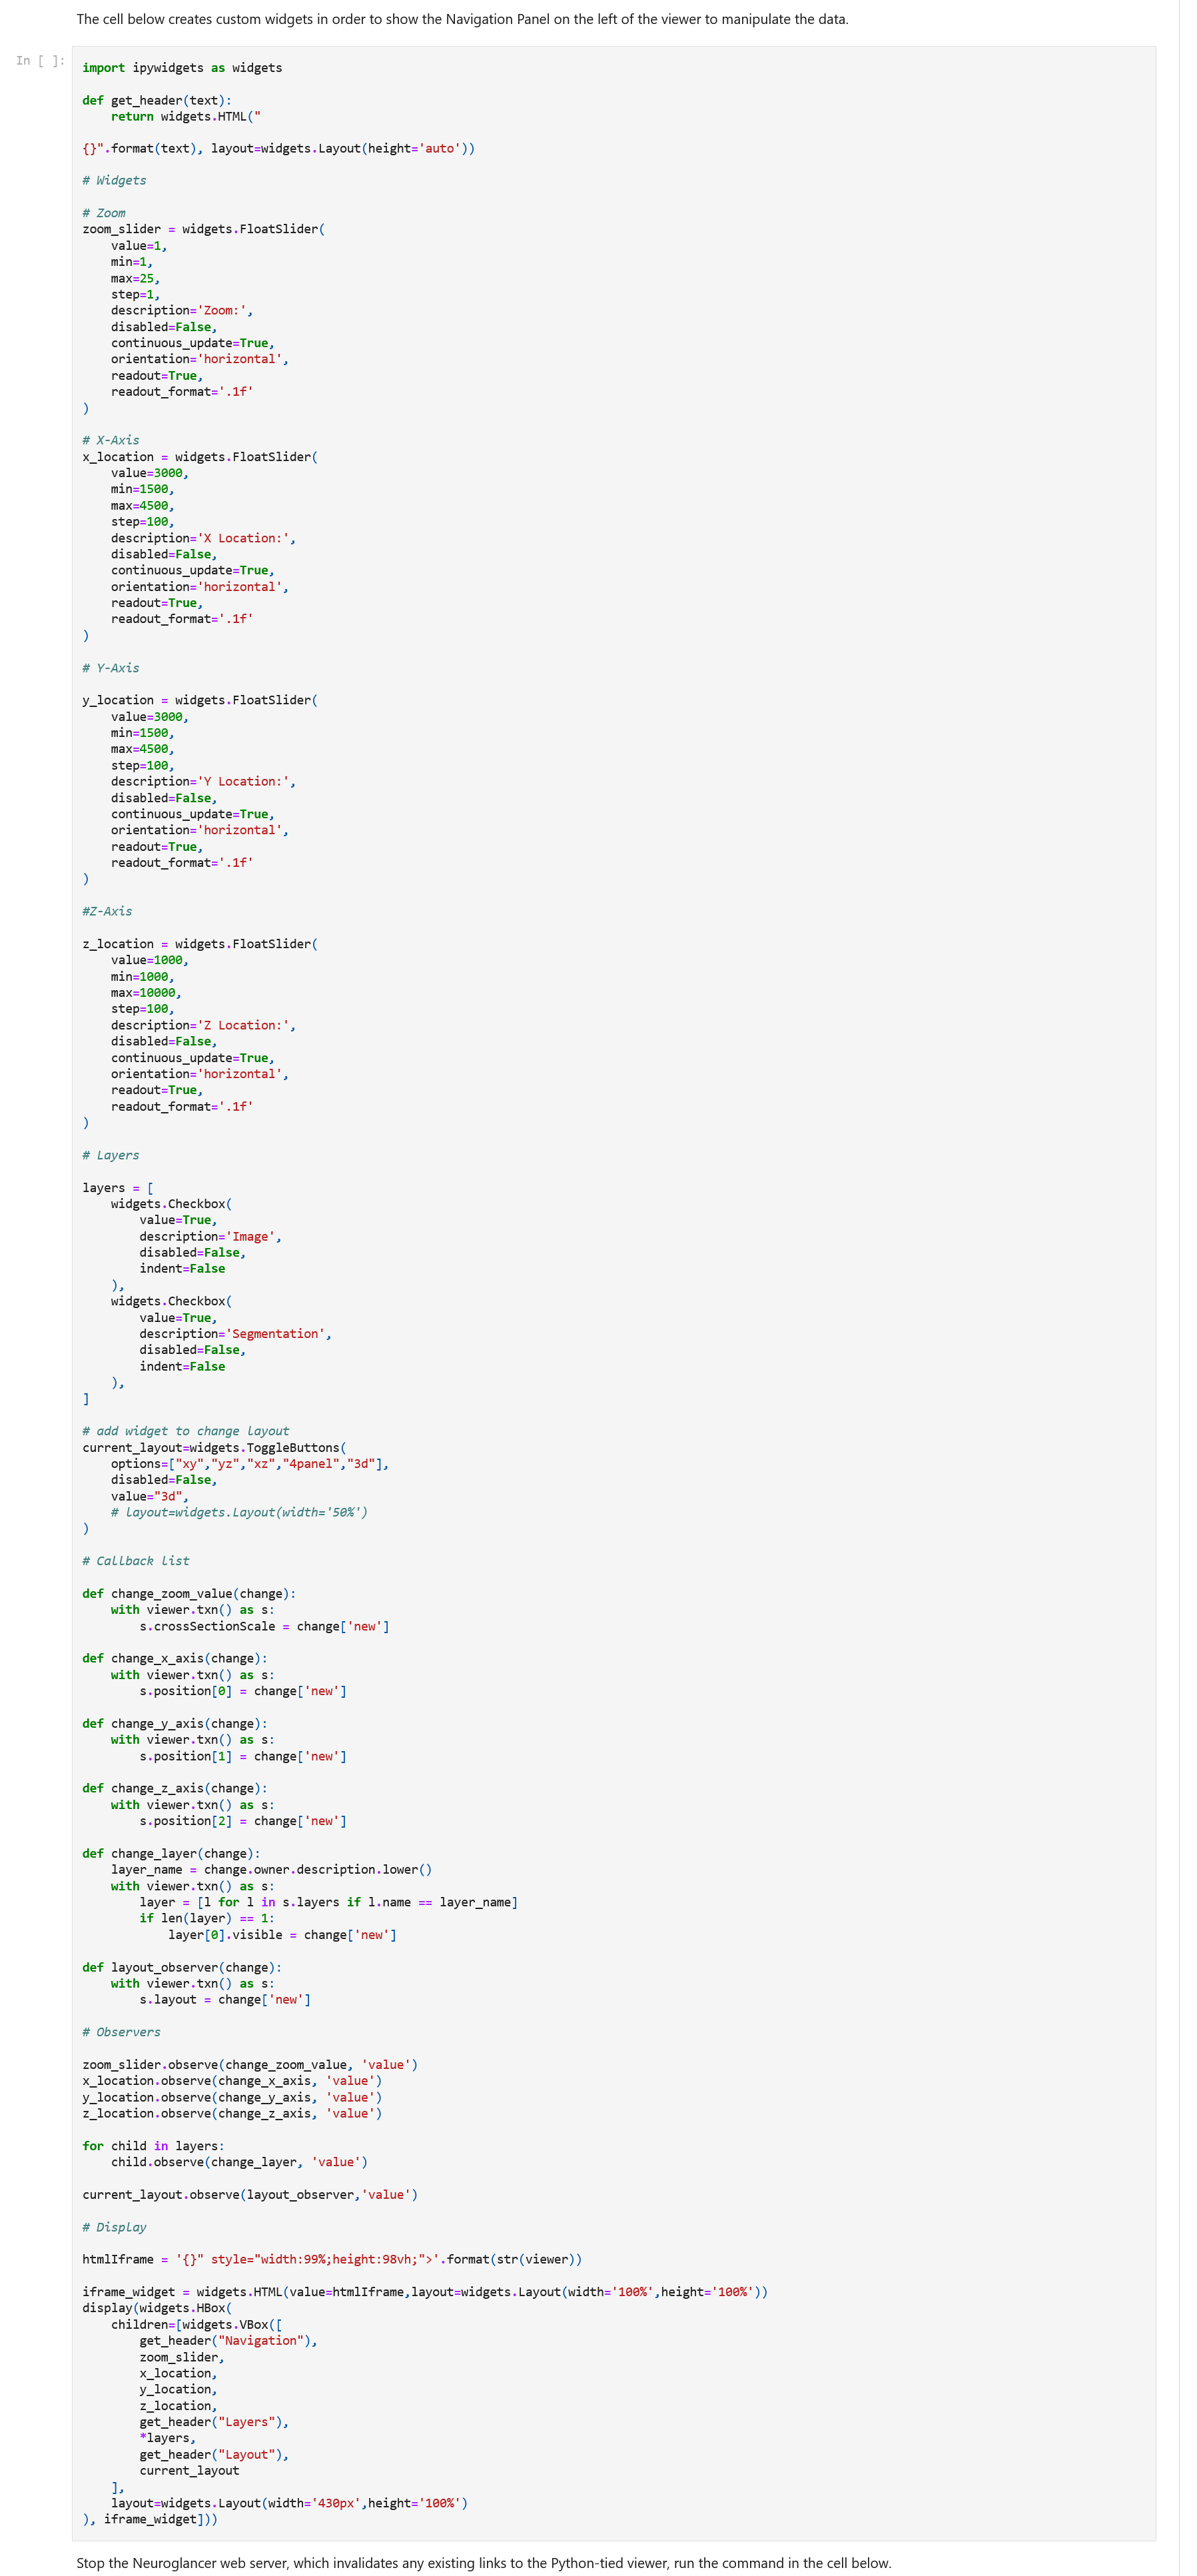
And this is the code that I wrote, to implement changes to the viewer. Also, I made it possible to use Neuroglancer methods to do changes in viewer state on Neuroglancer server side directly considering pretty limited Neuroglancer documentation.